
FinanceAI Dashboard
Design
https://igloo-cushy-91377949.figma.site/
Overview
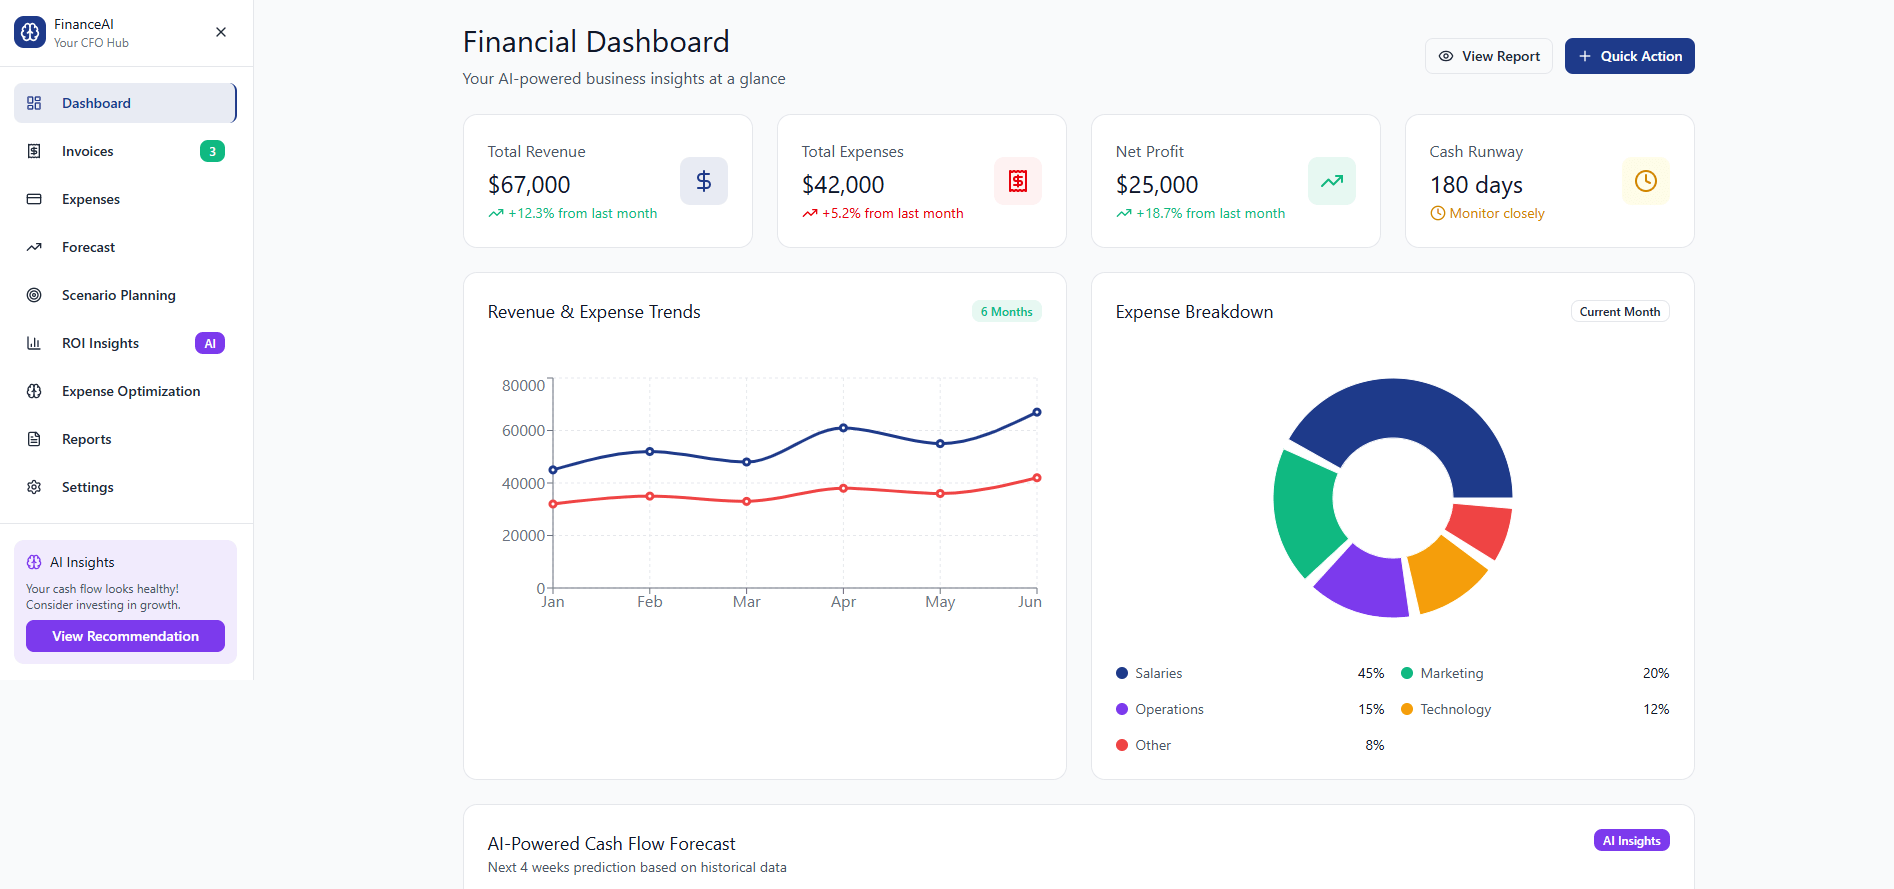
FinanceAI is a modern financial analytics platform that consolidates revenue, expenses, and profitability into a single, interactive dashboard. With built-in AI forecasting, expense optimization, and scenario planning, the platform empowers business leaders to make data-driven decisions quickly. The design emphasizes clarity, interactivity, and automation, helping organizations monitor financial health and predict future outcomes.
Technologies
- Frontend: React, Material-UI/Emotion, Redux, Chart.js
- Backend: Node.js, Express.js
- Database: MongoDB
- AI/Analytics: Machine learning models for forecasting (cash flow predictions, ROI analysis)
- Deployment: DigitalOcean
- Integrations: Payment data (Stripe), Authentication (Okta)
Features
- Financial Dashboard: At-a-glance view of revenue, expenses, profit, and cash runway.
- Revenue & Expense Trends: Interactive line charts showing month-over-month changes.
- Expense Breakdown: Dynamic pie charts highlighting spending categories.
- AI-Powered Forecasting: Predicts cash flow trends based on historical data.
- Scenario Planning: Simulate financial outcomes under different assumptions.
- ROI Insights: Visualize impact of decisions and investments.
- Expense Optimization: AI-driven suggestions to reduce unnecessary costs.
- Reports & Exports: Generate formatted financial summaries for sharing.
Development
- Designed a responsive React frontend with Material-UI, ensuring a clean and professional look for financial data.
- Built interactive data visualizations with AmCharts/Chart.js, providing trend analysis and breakdowns.
- Developed a Node.js backend with APIs for handling invoices, expenses, and forecasts.
- Implemented AI models to provide predictive insights (cash flow forecast, optimization tips).
- Integrated authentication and role-based access for CFOs, consultants, and clients.
- Optimized for performance to handle large financial datasets without slowing down UI interactions.
Challenges
- Complex Data Visualization: Representing revenue, expenses, and cash flow trends in a way that is both accurate and intuitive.
- AI Forecast Accuracy: Training and integrating predictive models into the frontend while keeping results understandable for end users.
- Data Integration: Pulling consistent, clean financial data from multiple sources (e.g., invoices, payments, accounting systems).
- User Experience: Designing dashboards that balance detail for CFOs with simplicity for business managers.
- Scalability: Ensuring that the dashboard could handle more users and larger datasets as businesses grow.
Conclusion
The FinanceAI Dashboard demonstrates the ability to combine data visualization, AI-driven insights, and financial management tools into a unified platform. By integrating React, Node.js, and AI forecasting models, the project delivers a powerful yet user-friendly tool for monitoring and improving financial health. The design showcases skills in frontend engineering, data visualization, and backend integration, while solving real-world challenges in business finance and decision-making.